Worldwide passenger and air cargo transport up 5 percent, ACI reveals
MONTRÉAL, 4 Sept. 2015. Global passenger traffic grew 5.7 percent and worldwide airport cargo increased 4.7 percent in 2014, even in the face of global uncertainties, according to the latest World Airport Traffic Report from Airports Council International (ACI) in Montreal, Canada.
"Passenger traffic remained resilient in the face of the global uncertainties that beleaguered many economies in 2013 and 2014," affirms ACI World Director General Angela Gittens. "International tourism, in particular, was irrepressible in 2014 considering the geopolitical risks that have persisted in certain parts of the world, such as Eastern Europe and the Middle East. The Ebola outbreak also presented significant challenges to the aviation sector. Notwithstanding, by and large, the international traveller in 2014 appears to have been immune to these potential dangers. Overall global passenger traffic grew at a rate of over 5 percent. This is above the 4.3 percent average annual growth rate in passenger traffic from 2004 to 2014.
"Despite the uneven recovery in the global economy, there was a net increase in global demand for foreign goods and commodities in 2014," Gittens adds. "The overall flow of exports and imports by sea, land and air, measured by world trade volumes in goods and services, has grown. The American economic rebound and the rise in consumer spending helped stimulate major exporters of high-tech goods such as tablets, laptops and mobile phones. This helped awaken the air cargo market in the last quarter of 2013 and into 2014 after several years of sluggish growth.
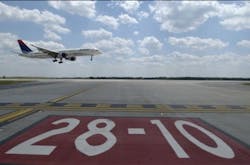
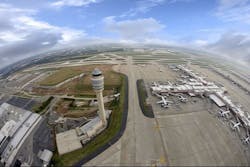
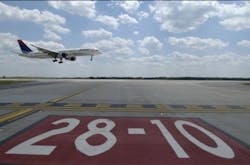
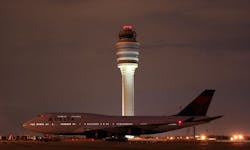
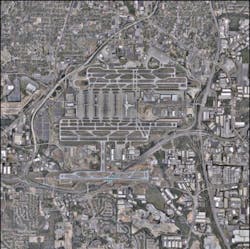
Worldwide airport passenger numbers increased by 5.7 percent in 2014 to over 6.7 billion, registering increases in all six regions. Atlanta (ATL) remains the world's busiest airport on the globe with 96 million passengers in 2014. Traffic at the airport was up 1.9 percent over 2013 while the second ranked Beijing (PEK), with 86 million passengers, experienced more subdued growth of 2.9 percent in 2014 as compared to the double-digit growth it had achieved in previous years. Airport traffic in emerging markets and developing economies experienced growth of 8 percent, whereas airports in advanced economies grew by 4 percent in 2014, with emerging markets reaching a 43 percent share of global passenger traffic. During 2014, the highest number of passengers went through airports in the Asia-Pacific region:
1. Asia-Pacific (2.3 billion, up 7.1% over 2013)
2. Europe (1.8 billion, up 5.5% over 2013)
3. North America (1.6 billion, up 3.2% over 2013)
4. Latin America-Caribbean (531 million, up 6.4% over 2013)
5. Middle East (308 million, up 10.8% over 2013)
6. Africa (180 million, up 2.7% over 2013)
With over 1.4 billion passengers, BRICS (Brazil, Russia, India, China, and South Africa) countries, which represent 21 percent of global passenger traffic, achieved strong growth of 9 percent in passenger traffic. MINT (Mexico, Indonesia, Nigeria, and Turkey) countries also achieved robust traffic growth, with a 7.2 percent increase for passenger traffic in 2014.
Although Dubai (DXB) is the sixth-busiest airport in the world in overall passenger traffic, it became the world's busiest in terms of international passenger traffic, ahead of London-Heathrow (LHR), in 2014.
Istanbul (+10.5%) remains one of the fastest-growing airports among the world's top 30 airports for passenger traffic, moving from 18th to 13th rank.
The world's top 30 airport cities handle more than one-third of global passenger traffic. London remains the world's largest airport system with almost 147 million passengers handled at six airports in and around the metropolitan area. New York maintains the second position with 116 million passengers at three airports. Tokyo is the third city market with 109 million passengers.
The world's busiest international airports (international passenger traffic):
1. Dubai, United Arab Emirates – DXB (69.9 million, up 6.2% over 2013)
2. London, United Kingdom – LHR (68.1 million, up 1.1% over 2013)
3. Hong Kong, China – HKG (62.9 million, up 6.1% over 2013)
The world's busiest domestic airports (domestic passenger traffic):
1. Atlanta GA, USA – ATL (85.4 million, up 1.5% over 2013)
2. Beijing, China – PEK (68.9 million, up 5.4% over 2013)
3. Tokyo, Japan – HND (62.2 million, up 2.1% over 2013)
Air cargo traffic
Worldwide airport cargo increased by 4.7 percent in 2014 to 102 million metric tons, with positive levels of growth across all six regions.
Hong Kong (HKG) and Memphis (MEM) take the first and second places respectively for the busiest air cargo airports with 4.4 million and 4.3 million metric tons in 2014.
Airports in the Asia-Pacific region handled the largest amount of air cargo during 2014:
1. Asia-Pacific (40.5 million metric tons, up 6.3% over 2013)
2. North America (28.9 million metric tons, up 3% over 2013)
3. Europe (18.4 million metric tons, up 3.2% over 2013)
4. Middle East (7.4 million metric tons, up 9.2% over 2013)
5. Latin America-Caribbean (5.0 million metric tons, up 0.6% over 2013)
6. Africa (1.9 million metric tons, up 5.1% over 2013)
The world's air cargo market is highly concentrated, with the top 30 air cargo hubs handling 53% of global air cargo volumes. Hong Kong and Memphis remain the busiest airports in terms of air cargo traffic (4.4 and 4.3 million metric tons of cargo respectively). The two Shanghai airports—PVG and SHA—handle 3.6 million tons combined, taking the third position in the air cargo hubs ranking.
The world's busiest international airports (international freight traffic):
1. Hong Kong, China – HKG (4.4 million metric tons, up 6% over 2013)
2. Incheon, Republic of Korea – ICN (2.5 million metric tons, up 3.3% over 2013)
3. Dubai, United Arab Emirates – DXB (2.4 million metric tons, down 3.1% over 2013)
The world's busiest domestic airports (domestic freight traffic):
1. Memphis TN, USA – MEM (4.0 million metric tons, up 3.4% over 2013)
2. Louisville KY, USA – SDF (1.8 million metric tons, up 4.3% over 2013)
3. Beijing, China – PEK (1.0 million metric tons, down 0.1% over 2013)
Aircraft movements
Worldwide aircraft movements increased by 1.3 percent in 2014 to 84.6 million, with mixed levels of growth across the regions.
Chicago (ORD) regained its position and became the busiest airport in terms of aircraft movements, followed by Atlanta (ATL) and Los Angeles (LAX).
Airports in the North American region recorded the highest number of movements during 2014:
1. North America (29.6 million, down 1.0% over 2013)
2. Europe (21.2 million, up 1.4% over 2013)
3. Asia-Pacific (19.7 million, up 5.0% over 2013)
4. Latin America-Caribbean (8.7 million, up 0.8% over 2013)
5. Africa (2.9 million, up 0.5% over 2013)
6. Middle East (2.6 million, up 4.8% over 2013)
2015 outlook
Preliminary airport traffic results for the first half of 2015 show encouraging signs of steady growth in the global passenger and cargo markets. The overall passenger growth rate in the first six months of 2014 was in the order of 5 percent, which is slightly above the equivalent year-over-year figure from 2014. Although the rate of growth in air cargo markets has slowed compared to 2014, air cargo is estimated to have grown by over 3 percent for the first half of 2014 as compared to the previous year.
[1] Data is based on information as of August 2015. The actual World Airport Traffic Report may contain updated and/or revised figures upon publication in September 2015.
Airports Council International (ACI), the worldwide association of airports, has 590 member airport authorities, which operate 1,850 airports in 173 countries. ACI's mission is to promote professional excellence in airport management and operations, and this mandate is carried out through the organization's multiple training opportunities, as well as the customer service benchmarking program, a wide range of conferences, industry statistical products, and best practice publications.
The World Airport Traffic Report 2014 (WATR 2014) is based on input from 2,215 commercial airports from over 160 countries, and presents data in five key global traffic categories: total passenger, total cargo, aircraft movements, international passenger and international freight. Rankings by order of busiest airports in each category are provided. The report also groups results region by region, country by country, as well as airport by airport.
ACI produces a range of publications covering airport policies/standards, monthly and yearly traffic reports, airport economics, and global traffic forecasting. The WATR 2014, as well as a suite of other ACI publications, can be purchased on the ACI website at www.aci.aero/Publications.
